Next: 6 Structure and Operations Up: 5 Graphical Output Previous: 5.1 Drawing Planar Diagrams Contents Index
![]()
![]()
![]()
![]()
![]()
Next: 6 Structure and Operations
Up: 5 Graphical Output
Previous: 5.1 Drawing Planar Diagrams
Contents
Index
|
In[2]:= ?BraidPlot
In[3]:= Options[BraidPlot]
|
Thus for example,
In[4]:= | br = BR[5, {{1,3}, {-2,-4}, {1, 3}}] |
Out[4]= | BR[5, {{1, 3}, {-2, -4}, {1, 3}}] |
In[5]:= | Show[BraidPlot[br]] |
 | |
Out[5]= | -Graphics- |
The Mode option to BraidPlot defaults to "Graphics",
which produces output as above. An alternative is setting
Mode -> "HTML", which produces an HTML <table> that can be
readily inserted into HTML documents:
In[6]:= | BraidPlot[br, Mode -> "HTML"] |
Out[6]= | <table cellspacing=0 cellpadding=0 border=0> <tr><td><img src=1.gif><img src=0.gif><img src=1.gif></td></tr> <tr><td><img src=2.gif><img src=3.gif><img src=2.gif></td></tr> <tr><td><img src=1.gif><img src=4.gif><img src=1.gif></td></tr> <tr><td><img src=2.gif><img src=3.gif><img src=2.gif></td></tr> <tr><td><img src=0.gif><img src=4.gif><img src=0.gif></td></tr> </table> |
The table produced contains an array of image inclusions that together draws the braid using 5 fundamental building blocks: a horizontal ``unbraided'' line (0.gif above), the upper and lower halves of an overcrossing (1.gif and 2.gif above) and the upper and lower halves of an underfcrossing (3.gif and 4.gif above).
Assuming 0.gif through 4.gif are
 ,
,  ,
,  ,
,
 and
and  ,
the above table is rendered as follows:
,
the above table is rendered as follows:
|
|
|
|
|
The meaning of the Images option to BraidPlot should be clear from reading its default definition:
In[7]:= | Images /. Options[BraidPlot] |
Out[7]= | {0.gif, 1.gif, 2.gif, 3.gif, 4.gif} |
The HTMLOpts option to BraidPlot allows to insert options
within the HTML <img> tags. Thus
In[8]:= | BraidPlot[ BR[2, {1, 1}], Mode -> "HTML", HTMLOpts -> "border=1" ] |
Out[8]= | <table cellspacing=0 cellpadding=0 border=0> <tr><td><img border=1 src=1.gif><img border=1 src=1.gif></td></tr> <tr><td><img border=1 src=2.gif><img border=1 src=2.gif></td></tr> </table> |
the above table is rendered as follows:
|
|
|
In[9]:= ?CollapseBraid
|
Thus compare the plots of br1 and br2 below:
In[10]:= | br1 = BR[TorusKnot[5, 4]] |
Out[10]= | BR[4, {1, 2, 3, 1, 2, 3, 1, 2, 3, 1, 2, 3, 1, 2, 3}] |
In[11]:= | Show[BraidPlot[br1]] |
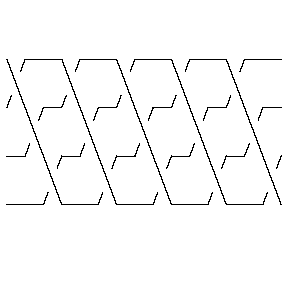 | |
Out[11]= | -Graphics- |
In[12]:= | br2 = CollapseBraid[BR[TorusKnot[5, 4]]] |
Out[12]= | BR[4, {{1}, {2}, {3, 1}, {2}, {3, 1}, {2}, {3, 1}, {2}, {3, 1}, {2}, {3}}] |
In[13]:= | Show[BraidPlot[br2]] |
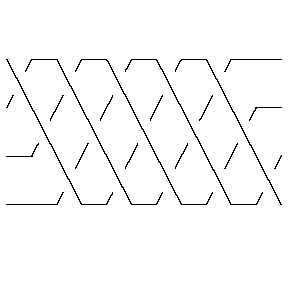 | |
Out[13]= | -Graphics- |