 Noise Harmonics
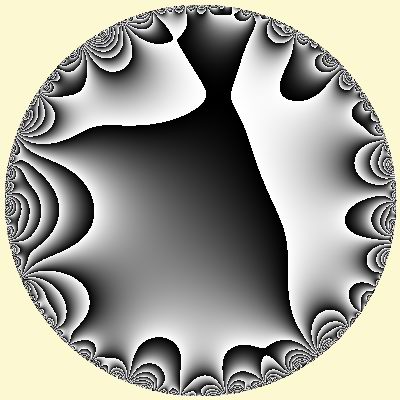
This picture is the graph of a function from the unit disk. The colors represent the values, but there are more values than colors, so the colors repeat periodically. Here are two ways to understand this function.
1. The values of the function on the boundary are independent Gaussians (white noise). Inside, the function is harmonic, that is, the value at every point equals the average of the values in a disk centered at that point. A harmonic function is determined by its boundary values.
2. The graph is created by taking the power series a0+a1z+a2z2+... where ai are complex, and their real and imaginary parts are independent Gaussians. This gives a complex valued function from the (complex) unit disk centered at the origin, and we take the real part.