
Graphing
Worked Examples
Hyperbolas
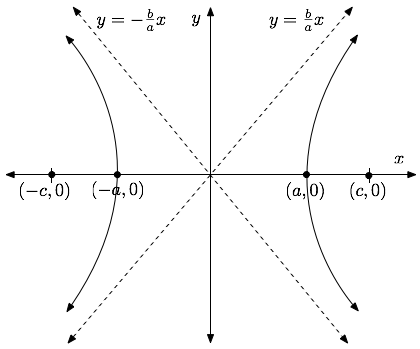
As in the case of an ellipse, a hyperbola is defined by two foci $P_1$ and $P_2$ and a distance $d$. It is the set of all points $P$ such that $|dist(P,P_1)-dist(P,P_2)|=d$. A hyperbola centered at the origin and aligned with the axes will have one of the following two standard equations:| A) | $\frac{x^2}{a^2} - \frac{y^2}{b^2} =1$ | Vertices: $(\pm a,0)$ |
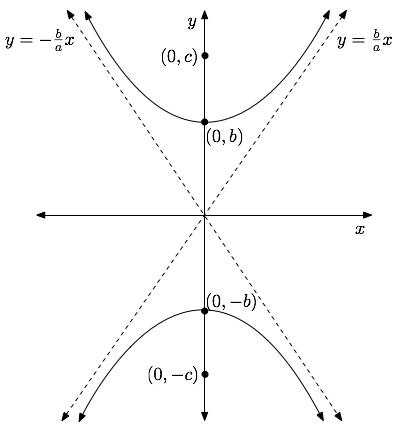
| B) | $\frac{y^2}{b^2} - \frac{x^2}{a^2} =1$ | Vertices: $(0,\pm b)$ |
Here, the asymptotes are given by $y = \pm \frac{b}{a} x$ ($a>0,b>0$).
The foci in type $A$ and $B$ are given by $(\pm c,0)$ and $(0, \pm c)$ respectively, where $c^2=a^2+b^2, c>0$.
The graphs of the two types of hyperbolas are:
 |
 |
Example. Find the foci and asymptotes of the hyperbola $4y^2 - 9x^2 - 36 = 0$ and graph it.
Solution: The standard form equation of this hyperbola is: $$\frac{y^2}{9} - \frac{x^2}{4}=1$$ We compute $c^2=4+9=13$, so $c=\sqrt{13}$. The equation is of the second type, and so the foci are on the $y$-axis, given by $(0, \pm \sqrt{13})$.The asymptotes are given by $y = \pm \frac{9}{4} x$.
To graph it, we solve for $y$: $$y = \pm 3 \sqrt{\frac{x^2}{4}+1}$$
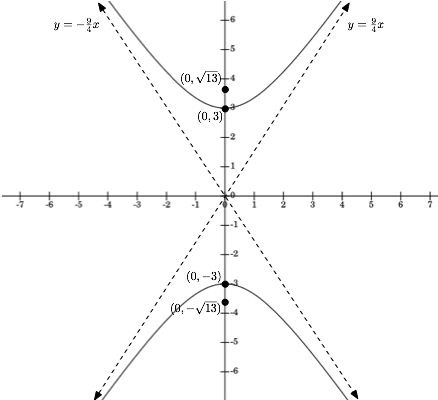
The graph of the hyperbola $\frac{y^2}{9} - \frac{x^2}{4}=1$