
| Dror Bar-Natan: Classes: 2002-03: Math 157 - Analysis I: | (235) |
Next: Class Notes for the Week of March 3 (1 of 6)
Previous: Wang Ying's Solution of Homework Assignment 21 |
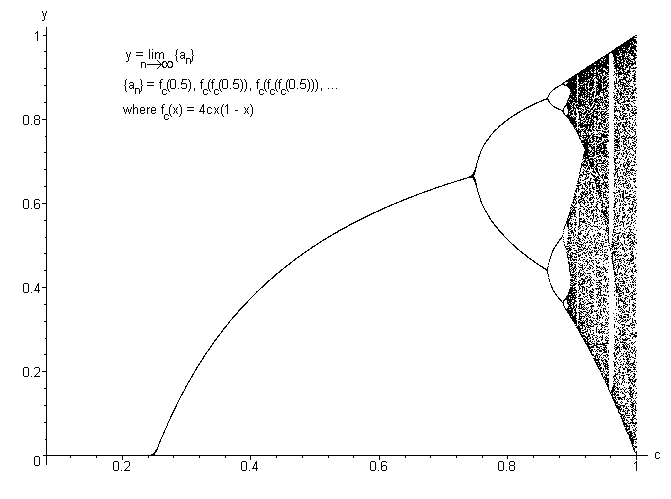
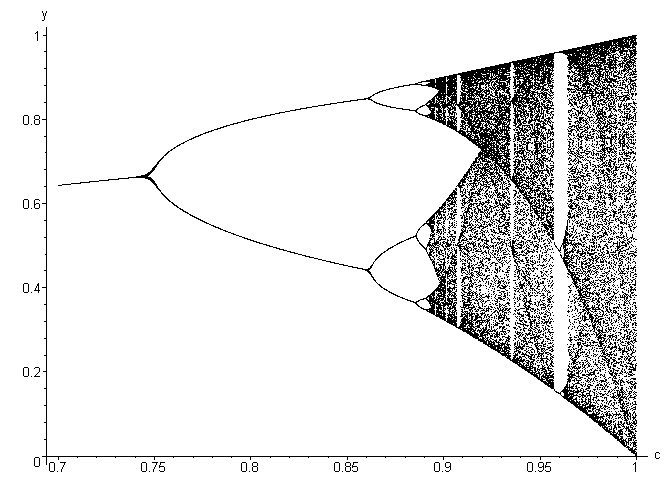
i did it in FORTRAN. it's very small and simple.Here's his program:i basically put the computed points in a file (in columns delimited by a space) and plotted them in Maple (but i supposed that you can use whatever program that you like). there are a lot of points though as my partition of [0,1] is quite fine (N = 2000). you can change this if you like, but it makes a nice picture.
program Chaos
        implicit none
        ! -----------------------------------------------Declare
        real*8 c, f_c, h
        integer*4 N, counter
        parameter (N = 2000)
        ! -----------------------------------------------Initialize
        h = 1./N
        c = 0.
        open(unit = 10, file = 'chaos')
        ! -----------------------------------------------Compute
        do while (.true.)
                if (c .gt. 1.) then
                        exit
                end if
                f_c = .5
                ! ----------------- Throw out a few 'generations' to get to the asymptotic behaviour
                do counter = 1, 125
                        f_c = 4*c*(f_c - f_c*f_c)
                end do
                ! ---------------- Let's keep these points and write them to our file
                do counter = 1, 75
                        f_c = 4*c*(f_c - f_c*f_c)
                        write(10,*) c, f_c
                end do
                c = c + h
        end do
        close(10)
        end

